GMAT Focus MBA score ranges vs acceptance rate
Compare GMAT Focus score ranges, means, and medians for top US and international MBA programs against estimated acceptance rates. Filter by school, region, and admit-rate band.
Published
By Graeme O'Connor, Founder of GMAT Panda. 99th percentile GMAT scorer, London Business School MBA alumnus (Dean's List, former Student Ambassador), 10+ years of GMAT tutoring and admissions consulting for top US and European schools.
This page is directional, designed for comparison and planning. Score ranges come from school-reported and publicly available data. Acceptance rates include a mix of official figures and estimates.
GMAT score is one factor among many in MBA admissions (GPA, work experience, essays, interviews). For a full comparison of the GMAT and GRE for MBA admissions, see our GMAT vs GRE for MBA admissions guide.
Key insights from the data
- GMAT correlates with selectivity at US schools, but the relationship is not linear
- GMAT is a stronger admissions signal at US M7/top-15 programs than at European schools like INSEAD, LBS, or HEC, where international experience and career diversity carry more weight
- High scores improve your odds but do not guarantee admission; low scores do not automatically disqualify you
- Variance is large even at top schools: the middle 80% ranges overlap significantly across programs
- Acceptance rates are directional, as not all schools disclose official figures
Notable outliers
- Columbia: ~730 average GMAT (M7-level) yet ~20-22% acceptance rate. Driven by structural factors: two intakes (August + January), a large class (~800-900 students), and a binding Early Decision round that boosts yield certainty and allows more admits. The applicant pool is highly polished and GMAT-heavy, so the average stays high even with more seats.
- Darden (Virginia): acceptance rate above 30% despite a very high average GMAT. Darden's case-study emphasis attracts many consulting-track applicants who tend to score well, but those candidates often receive multiple offers and choose other programs, pushing the acceptance rate up.
- INSEAD: higher acceptance rate than peers like LBS, partly because INSEAD runs two intakes per year and has a larger total class size. This increases capacity without diluting the caliber of applicants.
- Duke Fuqua: relatively low acceptance rate compared to peers, driven by a small class size and a large applicant pool. Fuqua is especially popular among consulting-track profiles, and the school places strong emphasis on collaborative culture and fit, which makes the admissions filter tighter than raw GMAT stats alone would suggest.
- HEC Paris: more competitive than its acceptance rate might suggest. A strong global brand, high FT ranking, Paris location, and a relatively small class size produce a large applicant-to-seat ratio, especially from Europe, Asia, and Africa.
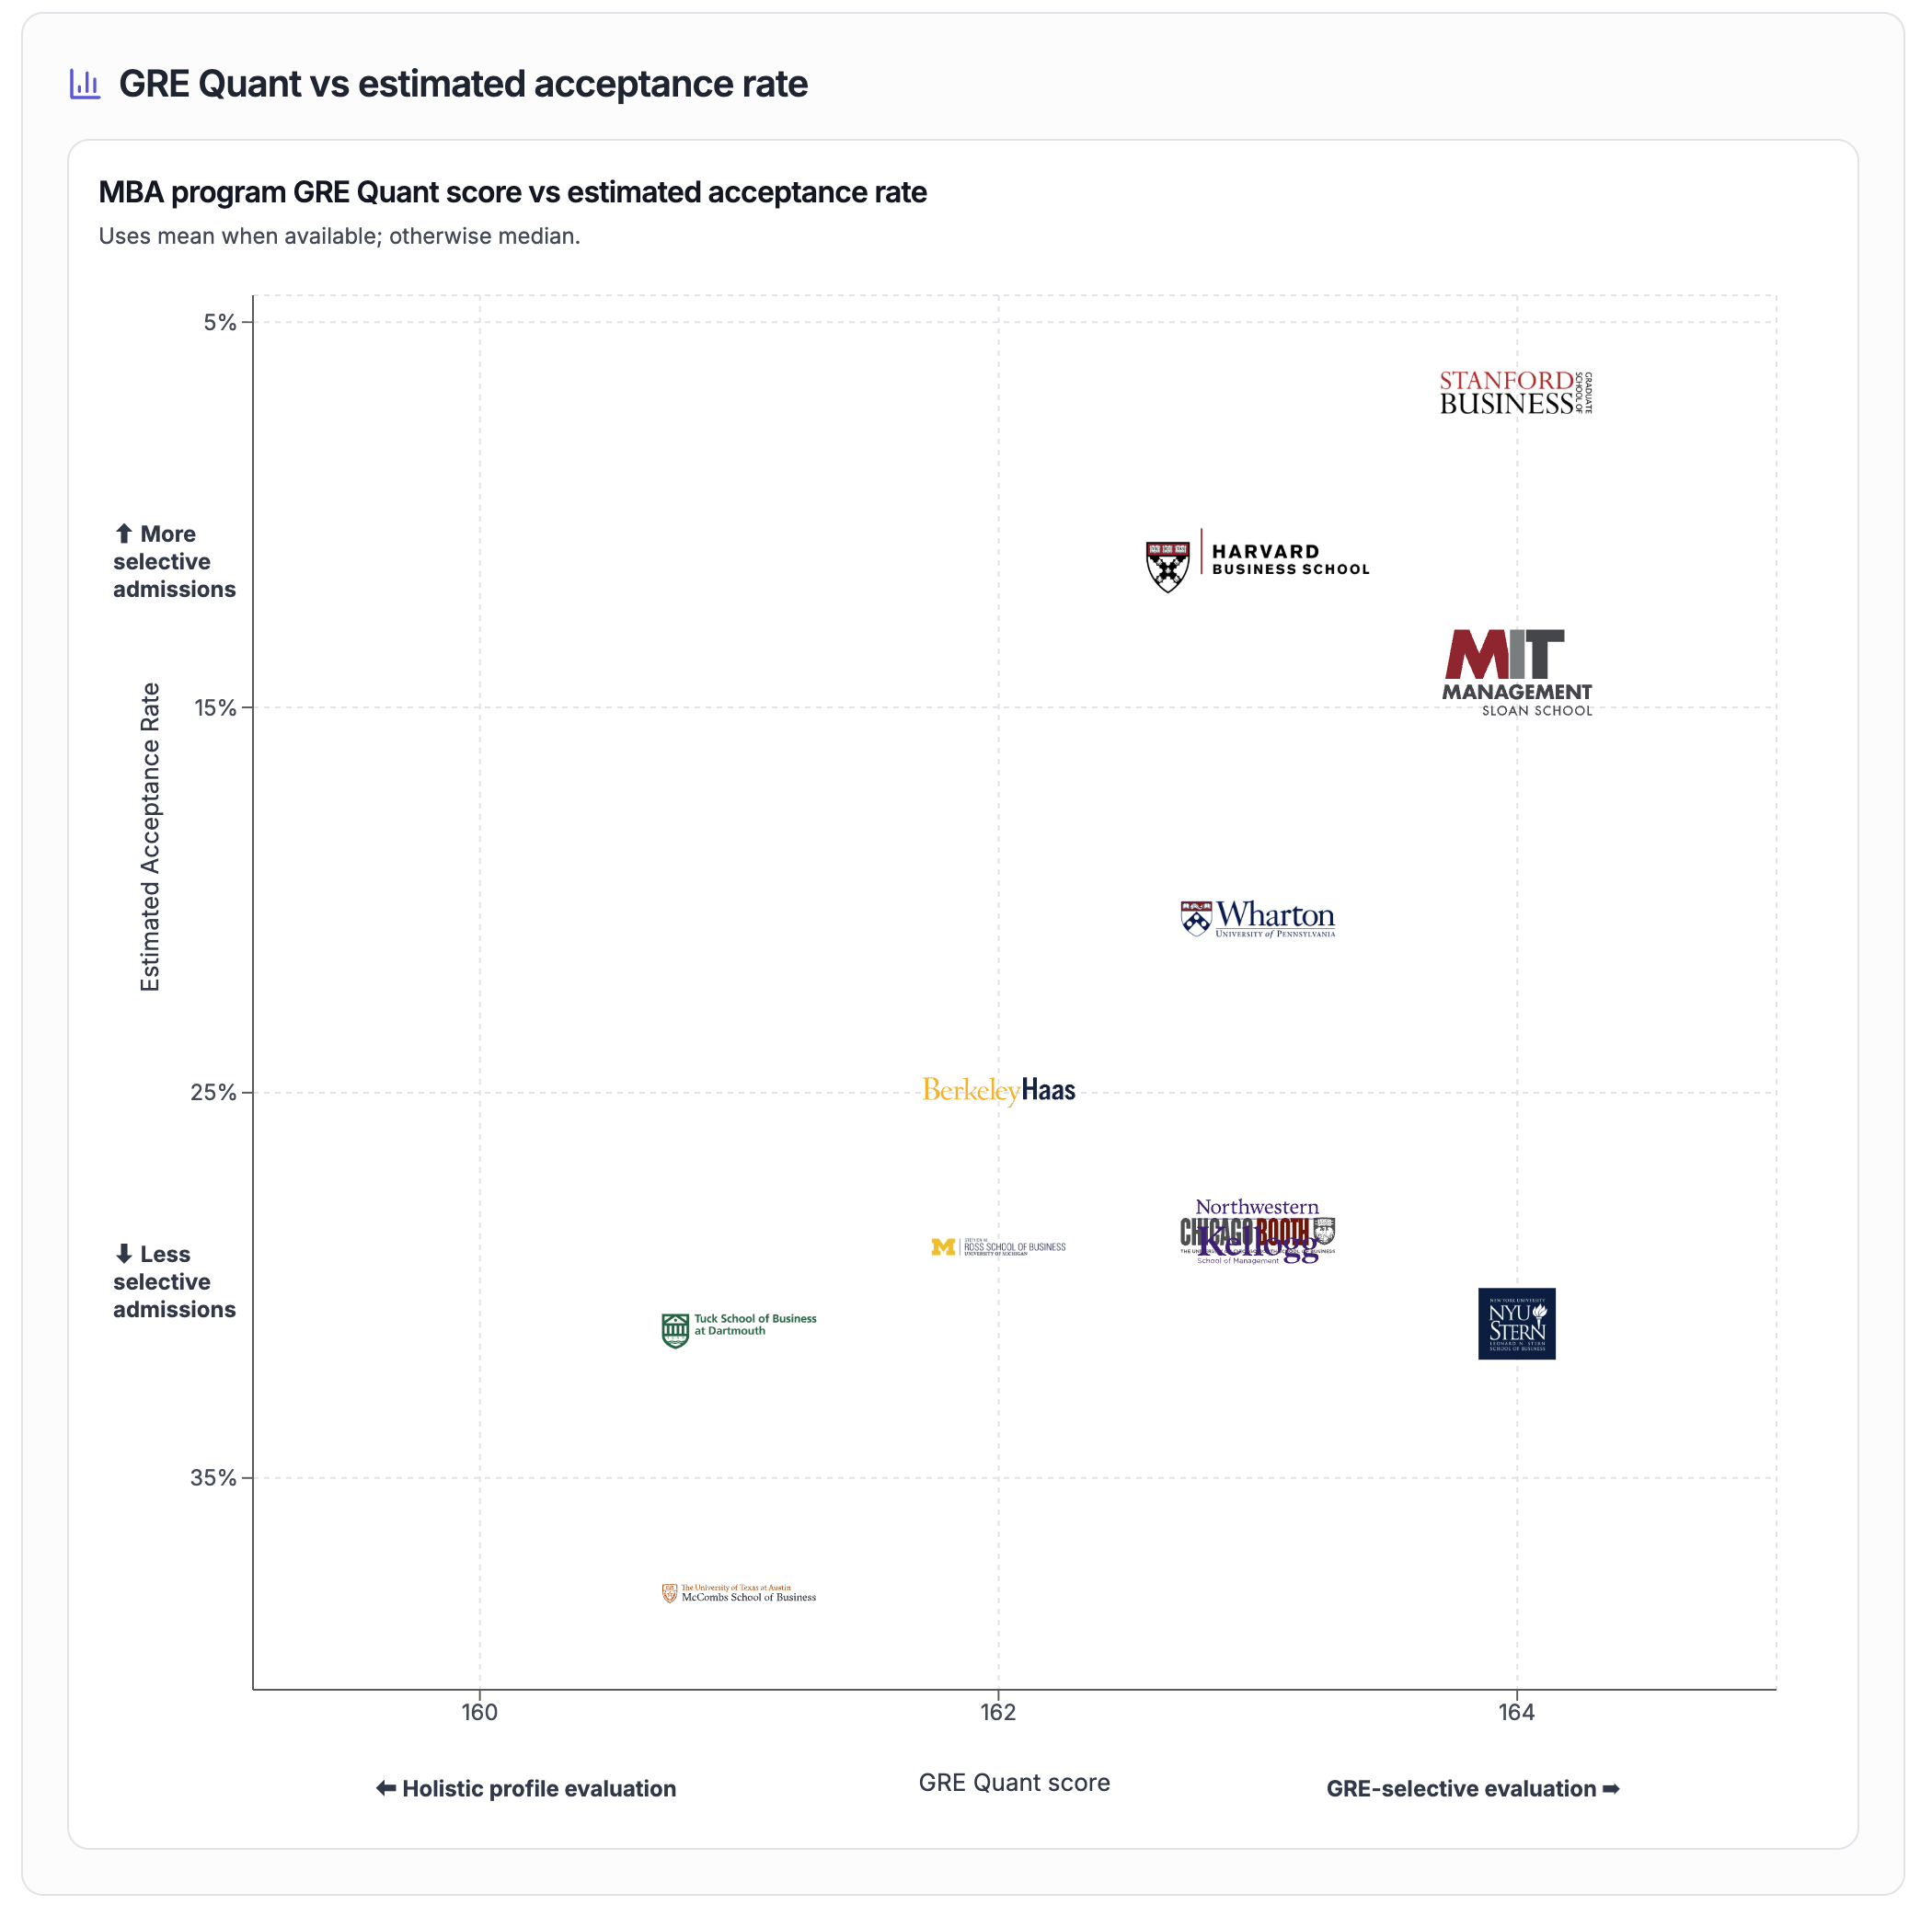
MBA Program GMAT score vs estimated acceptance rate
MBA Program GMAT score vs estimated acceptance rate
Uses mean when available; otherwise median.
At a Glance: What Affects Your Score
The charts above use GMAT Focus total scores (205–805) and school-reported ranges. The full scoring recipe is private, but here's what we know...How GMAT Focus scoring works.
Impacts your score
- Whether each item is correct or incorrect—based on your final (if you changed it) selected answer.
- The difficulty of the questions you answered
- Unanswered questions that effectively cap your score.
- Correct streaks push the question difficulty up and you score a lot of points on correct hard questions.
- Incorrect streaks (for example when guessing) push the question difficulty down and getting easy questions wrong is very penalizing.
Does not directly drive the score
- Experimental items (you cannot identify them; they are excluded from scoring).
- How fast you answer, by itself— there are no bonus points for answering a question quickly!
- Question order—where you get your correct answers has an impact on subsequent question difficulty but does not directly affect your score.
Deep dive: section scores, percentiles, adaptive difficulty, unanswered questions, timing, and guessing—about a ten-minute read.
GMAT Focus score ranges vs estimated MBA acceptance rates
How to use this as an applicant
How to read the chart
- Use the chart to identify your target school cluster
- Compare your score to the midpoint of admitted students, not just the lower bound
- Look at variance, not just averages: if the middle 80% range is wide, other application factors carry more weight at that school
Rules of thumb
- GMAT is most impactful at highly selective US schools (M7/top-15). At European programs, profile strength often matters more than the score itself.
- A higher GMAT does not guarantee admission. The wide spread in the data shows that other factors play a major role at every school.
Significantly above the school's average (about 30+ points on GMAT Focus total)
Compare your score to the school's published mean or median GMAT Focus total. If you sit clearly above that band (think on the order of 30 points or more), the GMAT is unlikely to be your limiting factor. Focus on essays, experience, and fit. A retake usually has low ROI unless you have a concrete plan to move the needle.
Around the school's average
You're competitive on score, but you are not pulling ahead on the test alone. Your profile (essays, impact, trajectory, fit) needs to do most of the heavy lifting. A modest retake can still help at the margin if you have a realistic path to a meaningfully higher score.
About 30 points below the school's average or below
Retaking is often high ROI if you can close the gap. Schools generally use your highest score, and a solid jump strengthens your whole application. If retaking is not realistic, add schools where your score sits closer to published averages and lean harder on the rest of your file.
If you are preparing for a retake or targeting a higher score, GMAT Panda can help you build the skills you need with structured, adaptive practice.
Start your free trialLabels such as (Public Data), (Inferred Estimate), and (Rough Estimate) describe how the acceptance rate was sourced. GMAT score data was sourced from each school, or Poets&Quants/GMAC where available.
Sources (acceptance rates and GMAT score data)
- Poets&Quants — Acceptance rates & yield at top US MBA programs
- GMAC — Acceptance rates at top business schools
- BusinessBecause — US business school acceptance rates
- U.S. News — Best business schools
- Poets&Quants — GMAT score reporting and school score coverage
- GMAC (mba.com) — Program Finder and school profile pages
Methodology
Source hierarchy
- School-published class profile (official website)
- Poets&Quants or GMAC aggregation
- U.S. News & World Report
- BusinessBecause
Score statistic used
Mean (average) when the school publishes it. Otherwise, median. Each data point is labeled with the statistic used.
Acceptance rate labels
- Public Data: school-published acceptance rate
- Inferred Estimate: derived from publicly available application and enrollment counts
- Rough Estimate: based on peer comparison or older reporting cycles
Known limitations
- Some schools have not yet reported GMAT Focus-era scores separately from classic GMAT scores
- Acceptance rates for some programs are cycle estimates
- Data covers full-time MBA programs only
Last updated:
Frequently asked questions
Related reading
Continue with these GMAT Panda articles.
Turn insight into prep progress
GMAT Panda helps you build the skills and recognition you need for test day with structured practice and explanations tied to real GMAT-style work.